.png?width=175&height=62&name=PMW-by-Rentvine-Logo%20(1).png)
- Login
- Dashboard Overview
- Website Performance Overview
- Google Ads - Campaigns
- Bing Ads - Campaigns
- Facebook Ads - Campaigns
- Call Tracking
- Google My Business
- Monthly Reporting
- Additional Resources
Customized Dashboard
With our Market Leader Program, we have created a customized dashboard to help you monitor your campaign performance at scale. Your current dashboard is based on your current marketing integrations. Our Advanced Reporting platform integrates with over 60 marketing channels. These integrations can be added to your dashboard and monthly reporting.
Please contact us at: concierge@propertymanagerwebsites.com to discuss any integrations you might be looking to add.
Accessing Your Report
Login
Login to your Dashboard at reporting.nesthub.com. If you need access to your dashboard, please contact us at: concierge@propertymanagerwebsites.com.
Once logged in, your dashboard will pre-populate based on your integrations. In the upper right-hand corner, you have the ability to change the time period, share your report, and edit your dashboard.
Understanding the Navigation
Left- Hand Side Navigation
On the left-hand side, you will find the navigation for all of your analytics. Each section is broken down by marketing channel. If you click on any specific widget on your dashboard, you will be taken to the corresponding section. You can easily return back to the dashboard by clicking the dashboard widget located at the top of the navigation bar on the left-hand side.
Upper Right-Hand Side Navigation
You have the ability to change the time frame from preselected periods or create your own custom date range. There is also the ability to customize the ‘Compare to Previous’ period. Options range from the previous period, the previous year, or you can create your own custom date range period.
Share your dashboard via downloadable PDF, send via email or share a link directly to your dashboard for easy communication across all departments. Under the same navigation, you will see the ability to ‘Add to Report’. All of this information is already in your monthly report. If you would like to create a new report or add other integrations, please contact us!
Dashboard Overview
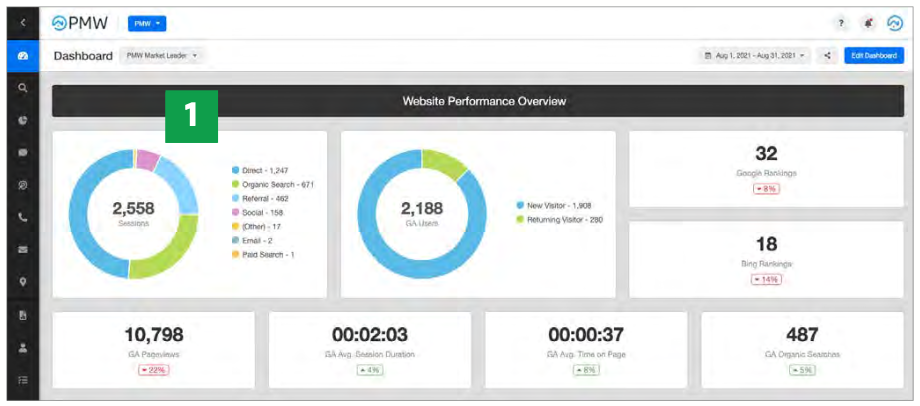
Website Performance Overview
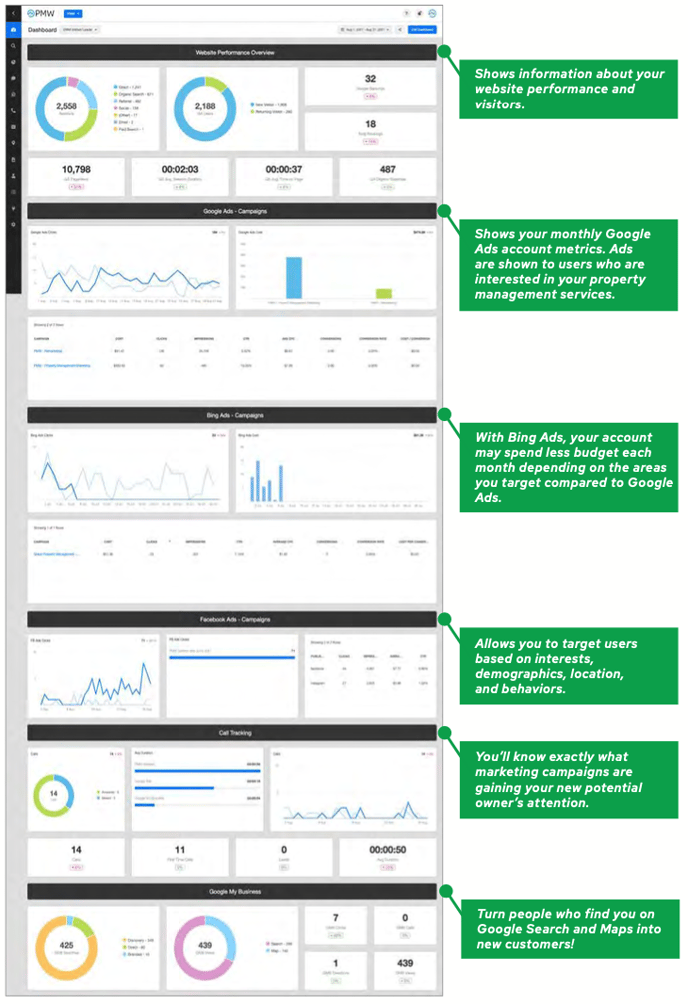
The website performance overview section shows information about your website performance and visitors. By default, the dashboards show website activity from the last month. You can use the filters to change the date range.
[1] CHANNEL SESSIONS
A session is a group of user interactions with your website that take place within a given
time frame. For example, a single session can contain multiple page views, events, social interactions, and ecommerce transactions.
A single user can open multiple sessions. Those sessions can occur on the same day, or over several days, weeks, or months. As soon as one session ends, there is then an opportunity to start a new session. There are two methods by which a session ends:
Time-based expiration:
• After 30 minutes of inactivity
• At midnight
Campaign change:
• If a user arrives via one campaign, leaves, and then comes back via a different campaign.
This pie chart shows the sessions categorized based on how they arrived to your website:
-
DIRECT: Traffic from users directly typing in your URL or bookmarks
-
ORGANIC SEARCH: Traffic from Search Engines such as Google, Bing, Yahoo, etc.
-
PAID SEARCH: Traffic from your Paid Search Ads
-
REFERRAL: Traffic from other websites
-
SOCIAL: Referral traffic from social media platforms such as Facebook, Twitter,
LinkedIn and other major social networks
-
OTHER: Google could not attribute the source of the traffic
-
EMAIL: Traffic from email
[2] NEW VS RETURNING USERS
This pie chart depicts new vs returning visitors to your website during the given time period
[3] GOOGLE RANKINGS
Your current Google Keyword rankings compared to the previous time period
[4] BING RANKINGS
Your current Bing Keyword rankings compared to the previous time period
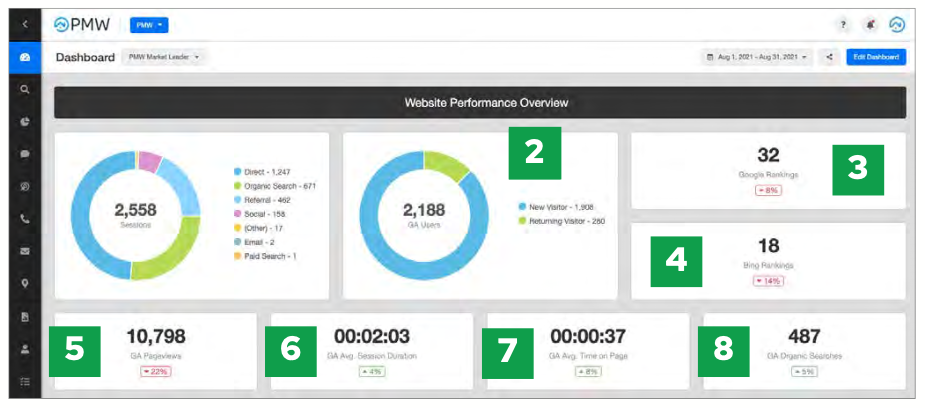
[5] GOOGLE ANALYTICS PAGEVIEWS
Your total number of pages viewed compared to the previous time period
[6] GOOGLE ANALYTICS AVG. SESSION DURATION
The average time a session lasts compared to the previous time period. A good session duration is 1-3 minutes. It may not seem like a ton of time, but it’s enough time for users to read content and interact with your website.
[7] GOOGLE ANALYTICS AVG. TIME ON PAGE
The average time on the page reflects how long a user spends on a specific landing page compared to the previous time period. A good average time on page is anywhere between 30 seconds and 60 seconds.
[8] GOOGLE ANALYTICS ORGANIC SEARCHES
Organic Searches reflect how many searches came to your website from search engines compared to the previous time period. Your organic sea
rches will depend on the search volume for property management services in your area.
Google Ads - Campaigns
Shows your monthly Google Ads account metrics. Ads are shown to users who are interested in your property management services. Check out your metrics below.
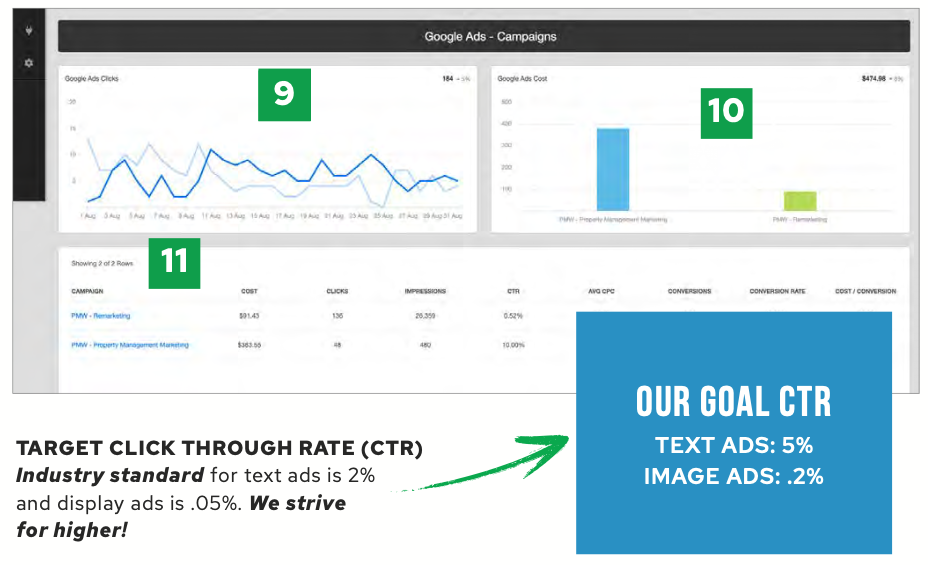
[9] GOOGLE ADS CLICKS
The total number of times your ads have been clicked on
[10] GOOGLE ADS COST
The total amount spent for a specific Google Ads campaign during the specific time period selected
[11] GOOGLE ADS CAMPAIGNS
A breakdown of all your Google Ads campaigns showing the following:
-
-
COST: The total amount you spent within a specific campaign during a specific time period
-
CLICKS: The total number of times your Google Ads have been clicked on
-
IMPRESSIONS: An impression is counted each time your Google Ad is shown during a
search
-
CTR (CLICK THROUGH RATE): A ratio showing how often users see your ad versus how often they click on your ad. Industry average CTR is 2% for text ad campaigns. Here at PMW, we aim for a 5% or above CTR
-
AVG CPC: The average cost per click within each campaign
-
CONVERSIONS: Total number of phone calls or form submissions from a user who
originally clicked on your Google Ad
-
CONVERSION RATE: How often, on average, a click leads to a conversion
-
COST / CONVERSION: The average cost per conversion (lead)
-
Bing Ads - Campaigns
With Bing Ads, your account may spend less budget each month depending on the areas you target, compared to Google Ads. Less users search on Bing compared to Google, which then leads to less competition within the ads section, less overall search volume & lower cost per clicks. Check out your metrics below.
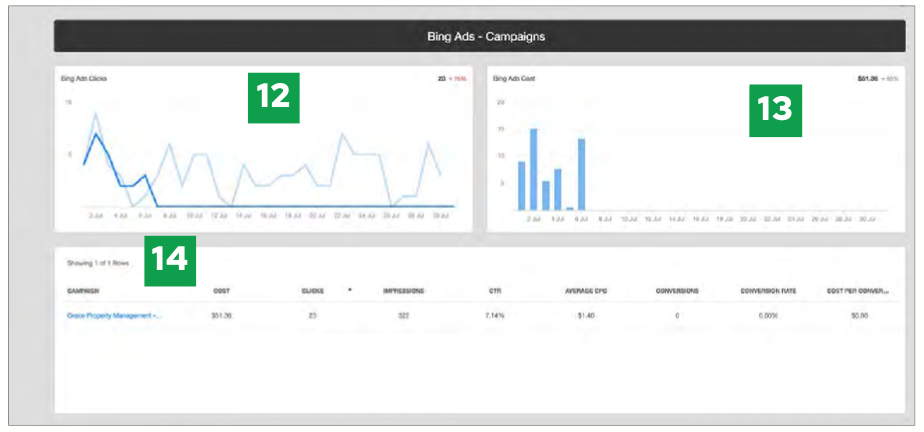
[12] BING ADS CLICKS
The total number of times your ads have been clicked on
[13] BING ADS COST
The total amount spent for a specific Google Ads campaign during the specific time period selected
[14] BING ADS CAMPAIGNS
A breakdown of all your Google Ads campaigns showing the following:
-
-
COST: The total amount you spent within a specific campaign during a specific time period
-
CLICKS: The total number of times your ads have been clicked on
-
IMPRESSIONS: An impression is counted each time your ad is shown during a search
-
CTR (CLICK THROUGH RATE): A ratio showing how often users see your ad versus how often they click on your ad. Industry average CTR is 2% for text ad campaigns. Here at PMW, we aim for a 5% or above CTR
-
AVG CPC: The average cost per click within each campaign
-
CONVERSIONS: Total number of phone calls or form submissions from a user who
originally clicked on your ad
-
CONVERSION RATE: How often, on average, a click leads to a conversion
-
COST / CONVERSION: The average cost per conversion (lead)
-
Facebook Ads - Campaigns
Facebook Ads allow you to target users based on interests, demographics, location, and behaviors.
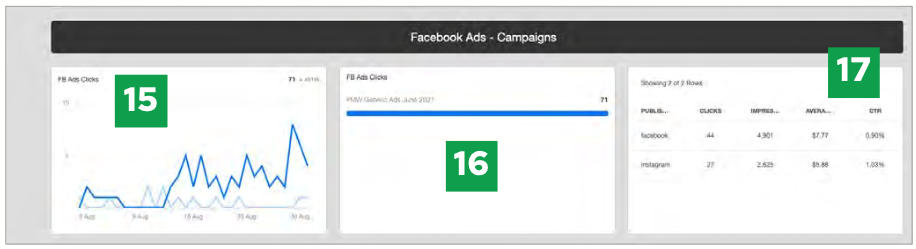
[15] FACEBOOK ADS CLICKS
The total number of times your ads have been clicked on
[16] FACEBOOK ADS CLICKS BY AD
The total number of times your Facebook Ads have been clicked on
[17] FACEBOOK ADS CAMPAIGNS TABLE
The number of clicks on all of your Facebook Ads broken down by the platform they were
published on:
-
-
PUBLISHED PLATFORM: Which platform your Facebook Ad was displayed on (ie Facebook or Instagram)
-
CLICKS: The total number of times your ads have been clicked on
-
IMPRESSIONS: An impression is counted each time your ad is shown. Facebook &
Instagram Ads can show in stories, news feeds, reels, etc.
-
AVERAGE CPC: The average cost per click within each campaign
-
CTR: A ratio showing how often users see your ad versus how often they click on your Facebook Ad.
-
Call Tracking
With call tracking software, you’ll know exactly what marketing campaigns are gaining your new potential owner’s attention. Check out your call tracking metrics below.
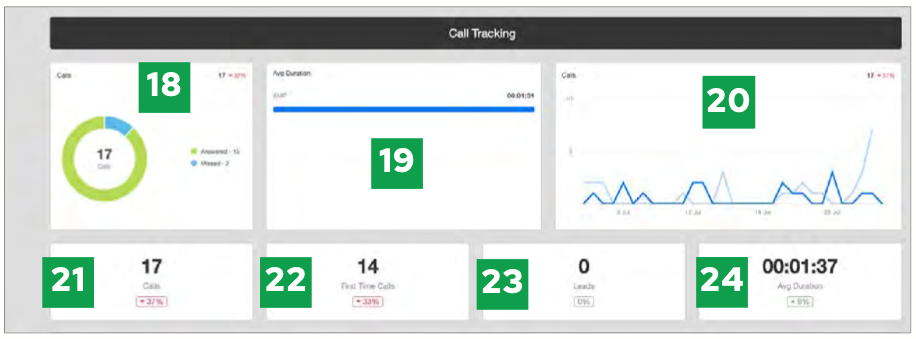
[18] CALLS PIE CHART
Total calls during a given time period displayed by Answered and Missed in a pie chart
[19] AVG. DURATION PER CAMPAIGN
Average Call Duration broken down by each number tracked within CallRail
[20] CALLS CHART
Total calls during a given time period displayed in a line chart
[21] CALLS
Total calls received during a given period compared to the previous period
[22] FIRST TIME CALLS
Total calls received by first-time callers compared to the previous period
[23] LEADS
A chat conversation you have marked as a lead
[24] AVG. DURATION TOTAL
The average duration of all calls during a given time period
Google My Business
Your Google My Business (GMB) Listing is your online storefront. Turn people who find you on Google Search and Maps into new customers! Check out your GMB metrics below.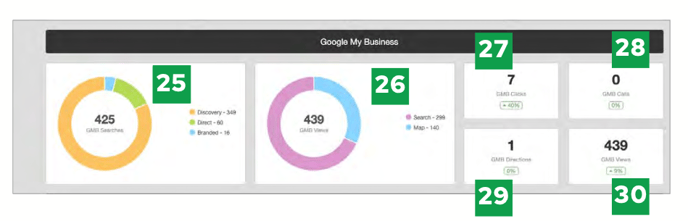
[25] GMB SEARCHES
Your GMB Search categories by Direct, Discovery, and Branded
- Direct: Customers who find your listing searching for your business name or address
- Discovery: Customers who find your listing searching for a category, product, or service
- Branded: Customers who find your listings searching for a brand related to your business
[26]GMB VIEWS
GMB views are categorized by if they see your GMB listing on search vs map
[27] GMB CLICKS
Total number of clicks on your GMB listing compared to the previous time period
[28] GMB CALLS
Total number of calls from your GMB listing compared to the previous time period
[29] GMB DIRECTIONS
Total number of clicks on your directions button on your GMB listing compared to the previous time period
[30] GMB VIEWS
The total number of views on your GMB listing compared to the previous time period
Monthly Reporting
Save time with scheduled reports. We have customized your Market Leader Report to automatically send to you and your team on the first of the month. Your report will include all the key metrics on your dashboard and more! Every report will be focused on the previous month’s data compared to the previous period, the month prior to the reporting month. For example, on January 1st, you will receive your monthly report for all of your data in December compared to November’s data.
If you would like your monthly report to go to additional team members, please contact us at: concierge@propertymanagerwebsites.com
Interested in becoming a Market Leader?
Interested in talking with an expert or ready to apply to become a Market Leader? Click here!
Additional Resources
PMW prides itself on having experts in all areas of property manager websites and digital marketing including SEO (Search Engine Optimization), Paid Search or Pay-Per-Click, Content Marketing, Email Marketing, and Social Media Marketing.
If you would like to meet with any one of our experts, please contact us at concierge@propertymanagerwebsites.com to discuss your needs. We will do all the heavy lifting and connect you with the right experts in the right departments.